Announcement

Collapse
No announcement yet.
X
  • Filter
  • Time
  • Show
Clear All
new posts

  • Code to add conditional Y distributions (at selected values of X) to a scatter-plot

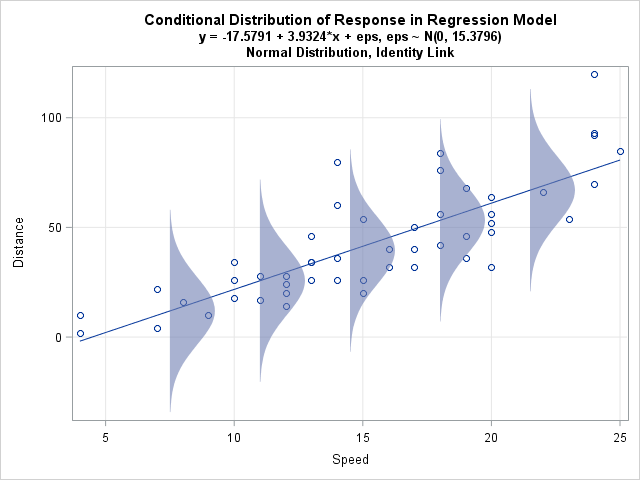
    Does anyone have code to add conditional Y distributions at selected values of X to scatter-plots? My main priority is getting the idealized normal distributions conforming to the IID N(0, sigma2) assumption, like this...


    But if I could plot empirical distributions too, that would be great.

    Thanks,
    Bruce


    --
    Bruce Weaver
    Email: [email protected]
    Version: Stata/MP 18.5 (Windows)

  • #2
    Dear Bruce, I am sorry to not have an answer for you, but, could you include the code that replicates your example?
    http://publicationslist.org/eric.melse

    Comment


    • #3
      Code:
      sysuse auto, clear
      set scheme s1mono
      
      // the basic graph
      gen ub = (_n-61)/20 in 1/61
      gen lb = - ub
      gen x = normalden(ub)
      twoway rarea ub lb x
      Click image for larger version

Name:	Graph.png
Views:	1
Size:	36.6 KB
ID:	1721745


      Code:
      // now apply it to a regression model
      reg price c.mpg##c.mpg
      
      // get the standard deviation
      local sd = e(rmse)
      
      // get the means
      margins, at(mpg=(15(5)35))
      forvalues i = 1/5 {
          local m`i' = el(r(table),1,`i')
      }
      
      // prepare the xs
      local i = 1
      foreach x of numlist 15(5)45 {
          gen x`i++' = x + `x'
      }
      
      // prepare the ys
      local gr = ""
      forvalues i = 1/5 {
          gen ub`i' = `m`i'' + ub*`sd'
          gen lb`i' = `m`i'' + lb*`sd'
          local gr = "`gr' rarea ub`i' lb`i' x`i', astyle(p3area) ||"
      }
      
      // the graph
      predict yhat
      twoway `gr' scatter price mpg, msymbol(oh) || ///
             line yhat mpg, lpattern(solid) sort legend(off)
      Click image for larger version

Name:	Graph.png
Views:	1
Size:	73.9 KB
ID:	1721746

      Code:
      // We need the "stretch" the normal graphs a bit
      // lets start with a factor 4
      local i = 1
      foreach x of numlist 15(5)45 {
          replace x`i++' = x*4 + `x'
      }
      twoway `gr' scatter price mpg, msymbol(oh) mcolor(black) || ///
             line yhat mpg, lpattern(solid) sort legend(off)  ///
             ylab(,angle(0) format(%9.0gc))
      Click image for larger version

Name:	Graph.png
Views:	1
Size:	75.9 KB
ID:	1721747

      ---------------------------------
      Maarten L. Buis
      University of Konstanz
      Department of history and sociology
      box 40
      78457 Konstanz
      Germany
      http://www.maartenbuis.nl
      ---------------------------------

      Comment


      • #4
        For conditional distributions of data, see also dotplot (official command) and stripplot from SSC.

        Comment


        • #5
          Many thanks, Maarten Buis and Nick Cox. ericmelse, I did not create the graph I showed in #1. It is from a SAS webpage.

          Cheers,
          Bruce
          --
          Bruce Weaver
          Email: [email protected]
          Version: Stata/MP 18.5 (Windows)

          Comment

          Working...
          X