Hi folks,
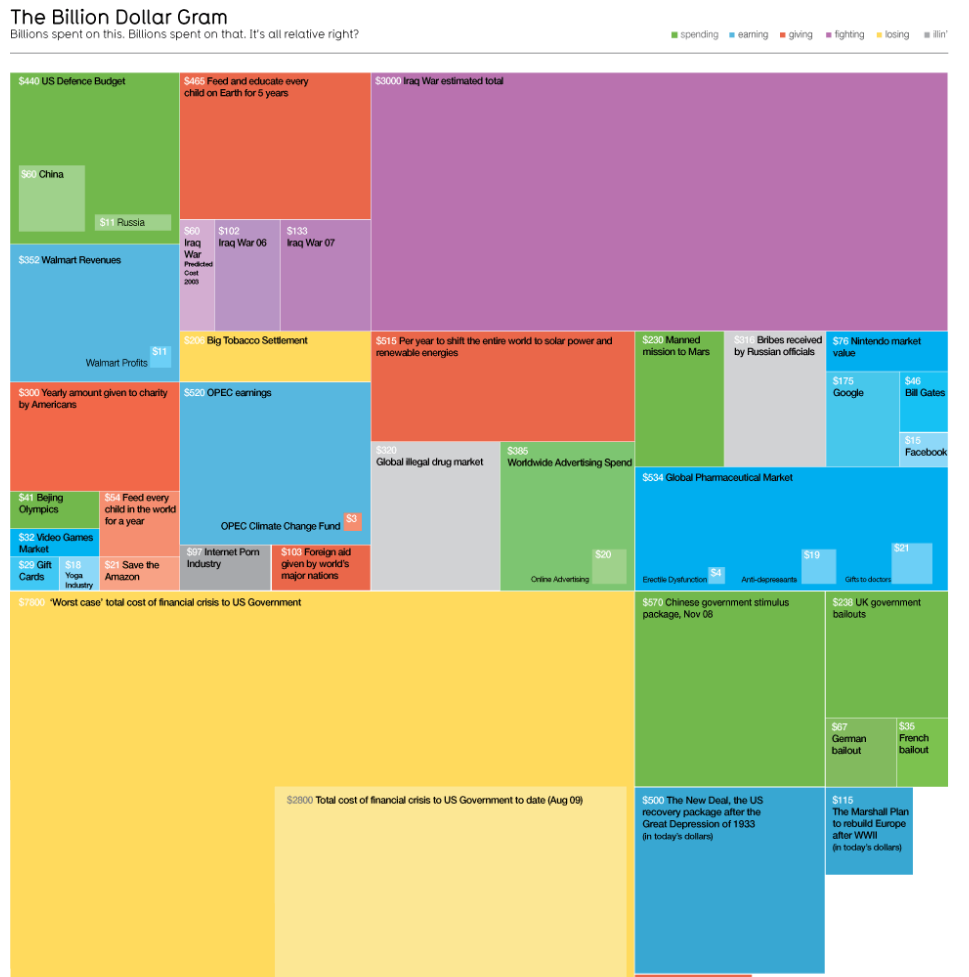
I know these are typically not recommended because they make comparing across categories difficult, but does anyone know if there's a way to produce proportional area charts, similar to the one below, in Stata?
Example data is pretty trivial, but here's some categorical data that could be visualized using a proportional area chart.
Code:
* Example generated by -dataex-. To install: ssc install dataex
clear
input str1 category
"A"
"A"
"A"
"A"
"A"
"A"
"A"
"A"
"A"
"A"
"B"
"B"
"B"
"B"
"B"
"C"
"C"
"C"
"C"
"C"
"C"
"C"
"C"
"C"
"C"
"C"
"C"
"C"
"C"
"C"
"D"
"D"
"D"
"D"
"D"
"D"
"D"
"D"
"D"
"D"
"D"
"D"
"D"
"D"
"D"
"D"
"D"
"D"
"D"
"D"
end
Comment