Dear fellow Stata users,
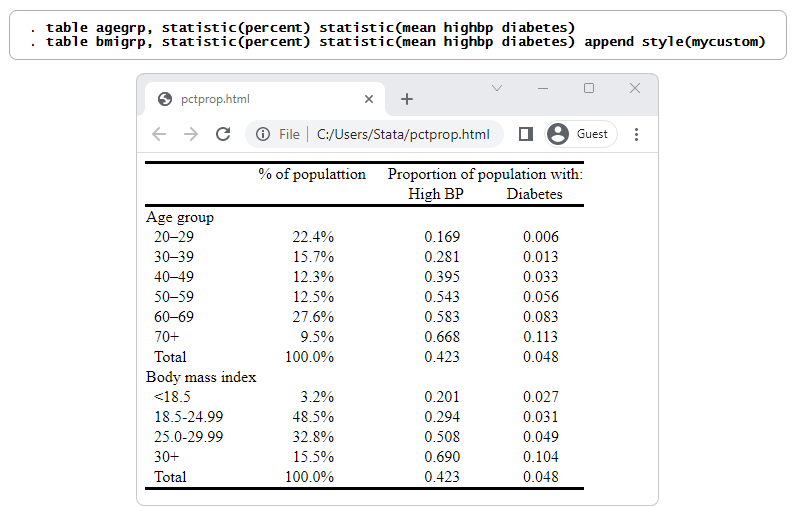
I would like to make a single table like the one below that shows the means of multiple variables (in the columns) across several categorical variables (in the rows).
The code below does most of what I want, but the results are in two separate tables. Does anyone know how to combine/stack/append these to make one table?
The example below (from https://www.stata.com/features/overv.../pctprop-2.png ) does not appear to show all the necessary code.
Thanks,
Jeremy
I would like to make a single table like the one below that shows the means of multiple variables (in the columns) across several categorical variables (in the rows).
The code below does most of what I want, but the results are in two separate tables. Does anyone know how to combine/stack/append these to make one table?
Code:
webuse nhanes2l,clear
table agegrp, statistic(percent) statistic(mean highbp diabetes)
table region, statistic(percent) statistic(mean highbp diabetes)
Thanks,
Jeremy
Comment