Announcement

Collapse
No announcement yet.
X
  • Filter
  • Time
  • Show
Clear All
new posts

  • How can I get etable to diplay coefficients in eform

    How can I get etable to diplay coefficients in eform? I couldn't find a documentation for it in etable command. Thanks

    Code:
    * Example generated by -dataex-. For more info, type help dataex
    clear
    input byte(y did group) float time byte parid
    0 0 1 0  1
    1 1 1 1  2
    0 1 1 1  3
    0 0 1 0  4
    0 0 1 0  5
    0 1 1 1  6
    0 0 1 0  7
    0 0 1 0  8
    0 0 1 0  9
    0 0 1 0 10
    0 0 1 0 11
    0 1 1 1 12
    0 0 1 0 13
    0 1 1 1 14
    0 1 1 1 15
    0 1 1 1 16
    . 1 1 1 17
    0 0 1 0 18
    0 1 1 1 19
    0 0 1 0 20
    1 1 1 1 21
    0 0 1 0 22
    1 0 0 0 23
    0 0 0 0 24
    0 0 0 0 25
    . 0 0 1  1
    0 0 0 1  2
    0 0 0 0  3
    0 0 0 1  4
    0 0 0 1  5
    0 0 0 1  6
    0 0 0 1  7
    0 0 0 0  8
    0 0 0 1  9
    0 0 0 0 10
    0 0 0 1 11
    0 0 0 1 12
    0 0 0 0 13
    1 0 0 1 14
    0 0 0 0 15
    0 0 0 1 16
    0 0 0 0 17
    0 0 0 0 18
    1 1 1 1 19
    1 0 1 0 20
    0 0 1 0 21
    1 1 1 1 22
    0 0 1 0 23
    0 0 1 0 24
    0 0 1 0 25
    end
    label values y y
    label def y 0 "Not Very Aware", modify
    label def y 1 "Very aware", modify
    label values group group
    label def group 0 "Control", modify
    label def group 1 "Intervention", modify
    label values time time
    label def time 0 "Baseline", modify
    label def time 1 "Endline", modify
    Code:
    xtset parid
    xtgee y i.did i.group i.time, family(binomial) link(probit) i(parid) t(time)
    ereturn list
    estimates store y
    margins, dydx(did) at(group = 1 time = 1) 
    matrix B = r(b)
    scalar y_dydx = B[1,2]
    matrix b = e(b)
    matrix b[1,2] = y_dydx
    erepost b = b
    estimates store y
    estimates replay y
    
    etable, estimates(y) stars(.05 "*", attach(_r_b)) showstars showstarsnote eqrecode(y=xb) column(dvlabel) cstat(_r_b)
    Code:
    GEE population-averaged model                        Number of obs    =     48
    Group variable: parid                                Number of groups =     25
    Family: Binomial                                     Obs per group:  
    Link:   Probit                                                    min =      1
    Correlation: exchangeable                                         avg =    1.9
                                                                      max =      2
                                                         Wald chi2(3)     =   5.17
    Scale parameter = 1                                  Prob > chi2      = 0.1596
    
    -------------------------------------------------------------------------------
                y | Coefficient  Std. err.      z    P>|z|     [95% conf. interval]
    --------------+----------------------------------------------------------------
            1.did |   .2982122   1.005176     0.30   0.767    -1.671896     2.26832
                  |
            group |
    Intervention  |  -.0252552   .7529433    -0.03   0.973    -1.500997    1.450487
                  |
             time |
         Endline  |   .0082213   .7968892     0.01   0.992    -1.553653    1.570095
            _cons |  -1.398875   .5682962    -2.46   0.014    -2.512715   -.2850349
    -------------------------------------------------------------------------------
    
    . 
    . etable, estimates(y) stars(.05 "*", attach(_r_b)) showstars showstarsnote eqrecode(y=xb) column(dvlabel) cstat(_r_b)
    
    -------------------------------
                               y   
    -------------------------------
    did                            
      1                     0.298  
    group                          
      Intervention         -0.025  
    time                           
      Endline               0.008  
    Intercept              -1.399 *
    Number of observations     48  
    -------------------------------
    * p<.0

  • #2
    Code:
    etable, estimates(y) stars(.05 "*", attach(_r_b)) showstars showstarsnote ///
        eqrecode(y=xb) column(dvlabel) cstat(_r_b, nformat(%10.3e))

    Comment


    • #3
      Originally posted by Clyde Schechter View Post
      Code:
      etable, estimates(y) stars(.05 "*", attach(_r_b)) showstars showstarsnote ///
      eqrecode(y=xb) column(dvlabel) cstat(_r_b, nformat(%10.3e))
      Thank you. Below is the results but that is not what I wanted. What I wanted is having the coefficients converted to odds, exp(b).

      Code:
      . etable, estimates(y) stars(.05 "*", attach(_r_b)) showstars showstarsnote eqrecode(y=xb) column(dvlabel) cstat(_r_b, nformat(%10.3e))
      
      -----------------------------------
                                   y    
      -----------------------------------
      did                                
        1                     2.982e-01  
      group                              
        Intervention         -2.526e-02  
      time                              
        Endline               8.221e-03  
      Intercept              -1.399e+00 *
      Number of observations         48  
      -----------------------------------
      * p<.05
      Last edited by Kehinde Atoloye; 16 Apr 2024, 12:09.

      Comment


      • #4
        first, you are estimating a probit model and exponentiating will not give you odds ratios

        second, I think, but I'm not sure, that etable reports the coefficients as they appear in the estimated results; thus, if you used logit rather than probit and added the "eform" option, I think you will get what you are asking for

        Comment


        • #5
          You can't. It doesn't even make sense. You are working with a probit regression--there is no connection between probit coefficients and odds ratios.

          Comment


          • #6
            Originally posted by Clyde Schechter View Post
            You can't. It doesn't even make sense. You are working with a probit regression--there is no connection between probit coefficients and odds ratios.
            I quite agree with you since it is probit. but in a case it is logit (as I intend to change to it) I would still want to do the conversion. The nformat approach only multiplies the coefficient by 10n instead of doing exp(b).

            Comment


            • #7
              Rich gave you the answer in #4. Include the -eform- option in the command and etable will output odds ratios.

              Comment


              • #8
                Originally posted by Andrew Musau View Post
                Rich gave you the answer in #4. Include the -eform- option in the command and etable will output odds ratios.
                Thank you. I understand that including eform option in the xtgee command will give me odds ratios. But you would observe from the codes I included above that I edited the e(b) matrix of the xtgee results and stored it back in memory. This led to loosing the eform for the coefficients. Since I lost the eform, is their a way of getting it back to reflect on the edits made in the results?

                Comment


                • #9
                  Well, you are right about losing the eform with the edit. And I don't know of any way you can get it back.

                  But, the edit you are doing also makes no sense. You are replacing, in this case, an odds ratio with a marginal effect--which is a probability difference. So it is neither in the coefficient metric (where exponentiation would give you an odds ratio) nor an odds ratio itself. Even with a logistic regression initially, it is simply not the case that exponentiating a marginal effect leads to an odds ratio. It leads to....I don't know what it leads to, it doesn't lead to anything nameable.

                  Comment


                  • #10
                    Originally posted by Clyde Schechter View Post
                    Well, you are right about losing the eform with the edit. And I don't know of any way you can get it back.

                    But, the edit you are doing also makes no sense. You are replacing, in this case, an odds ratio with a marginal effect--which is a probability difference. So it is neither in the coefficient metric (where exponentiation would give you an odds ratio) nor an odds ratio itself. Even with a logistic regression initially, it is simply not the case that exponentiating a marginal effect leads to an odds ratio. It leads to....I don't know what it leads to, it doesn't lead to anything nameable.
                    I quite understand. What led to editing it is that I am trying to do a DiD analysis. I had read that the interaction effect does not give the true ATET for interactions in logit models. The marginal effect approach was suggested on this thread https://www.statalist.org/forums/for...al#post1737357. There are other literatures which have also discussed the marginal effect approach. I then thought to do a replacement to allow me to present it in the same table with other coefficients.

                    Comment


                    • #11
                      Here is how you can replace e(b) and e(V) using erepost from SSC. Notice that I put the coefficients' and VCE matrix back into the estimation results after manipulation.

                      Code:
                      * Example generated by -dataex-. For more info, type help dataex
                      clear
                      input byte(y did group) float time byte parid
                      0 0 1 0  1
                      1 1 1 1  2
                      0 1 1 1  3
                      0 0 1 0  4
                      0 0 1 0  5
                      0 1 1 1  6
                      0 0 1 0  7
                      0 0 1 0  8
                      0 0 1 0  9
                      0 0 1 0 10
                      0 0 1 0 11
                      0 1 1 1 12
                      0 0 1 0 13
                      0 1 1 1 14
                      0 1 1 1 15
                      0 1 1 1 16
                      . 1 1 1 17
                      0 0 1 0 18
                      0 1 1 1 19
                      0 0 1 0 20
                      1 1 1 1 21
                      0 0 1 0 22
                      1 0 0 0 23
                      0 0 0 0 24
                      0 0 0 0 25
                      . 0 0 1  1
                      0 0 0 1  2
                      0 0 0 0  3
                      0 0 0 1  4
                      0 0 0 1  5
                      0 0 0 1  6
                      0 0 0 1  7
                      0 0 0 0  8
                      0 0 0 1  9
                      0 0 0 0 10
                      0 0 0 1 11
                      0 0 0 1 12
                      0 0 0 0 13
                      1 0 0 1 14
                      0 0 0 0 15
                      0 0 0 1 16
                      0 0 0 0 17
                      0 0 0 0 18
                      1 1 1 1 19
                      1 0 1 0 20
                      0 0 1 0 21
                      1 1 1 1 22
                      0 0 1 0 23
                      0 0 1 0 24
                      0 0 1 0 25
                      end
                      label values y y
                      label def y 0 "Not Very Aware", modify
                      label def y 1 "Very aware", modify
                      label values group group
                      label def group 0 "Control", modify
                      label def group 1 "Intervention", modify
                      label values time time
                      label def time 0 "Baseline", modify
                      label def time 1 "Endline", modify
                      
                      xtset parid
                      xtgee y i.did i.group i.time, family(binomial) link(logit) i(parid) t(time) eform
                      matrix V= r(table)["se", 1 ...]'*r(table)["se", 1 ...]
                      
                      *NOTE THAT THE LAST REGRESSION HAS NO -eform-
                      xtgee y i.did i.group i.time, family(binomial) link(logit) i(parid) t(time)
                      
                      matrix b= e(b)
                      mata: st_matrix("b", exp(st_matrix("b")))
                      mat colnames b= `:colnames e(b)'
                      
                      mata: st_matrix("V", editmissing(diag(st_matrix("V")), 0))
                      erepost b=b, rename
                      erepost V=V, rename
                      etable
                      Res.:

                      Code:
                      . xtgee y i.did i.group i.time, family(binomial) link(logit) i(parid) t(time) eform
                      
                      Iteration 1:  Tolerance = .30712998
                      Iteration 2:  Tolerance = .03439984
                      Iteration 3:  Tolerance = .00218555
                      Iteration 4:  Tolerance = .00047296
                      Iteration 5:  Tolerance = .0000514
                      Iteration 6:  Tolerance = 8.261e-06
                      Iteration 7:  Tolerance = 1.034e-06
                      Iteration 8:  Tolerance = 1.528e-07
                      
                      GEE population-averaged model                        Number of obs    =     48
                      Group variable: parid                                Number of groups =     25
                      Family: Binomial                                     Obs per group:  
                      Link:   Logit                                                     min =      1
                      Correlation: exchangeable                                         avg =    1.9
                                                                                        max =      2
                                                                           Wald chi2(3)     =   5.19
                      Scale parameter = 1                                  Prob > chi2      = 0.1586
                      
                      -------------------------------------------------------------------------------
                                  y | Odds ratio   Std. err.      z    P>|z|     [95% conf. interval]
                      --------------+----------------------------------------------------------------
                              1.did |   7.102497   14.00676     0.99   0.320     .1488556    338.8887
                                    |
                              group |
                      Intervention  |   .9501747   1.446613    -0.03   0.973       .04807    18.78162
                                    |
                               time |
                           Endline  |   1.016694   1.631637     0.01   0.992     .0437667    23.61766
                              _cons |   .0880508   .1008924    -2.12   0.034     .0093194    .8319103
                      -------------------------------------------------------------------------------
                      Note: _cons estimates baseline odds (conditional on zero random effects).
                      
                      .
                      . matrix V= r(table)["se", 1 ...]'*r(table)["se", 1 ...]
                      
                      .
                      . xtgee y i.did i.group i.time, family(binomial) link(logit) i(parid) t(time)
                      
                      Iteration 1:  Tolerance = .30712998
                      Iteration 2:  Tolerance = .03439984
                      Iteration 3:  Tolerance = .00218555
                      Iteration 4:  Tolerance = .00047296
                      Iteration 5:  Tolerance = .0000514
                      Iteration 6:  Tolerance = 8.261e-06
                      Iteration 7:  Tolerance = 1.034e-06
                      Iteration 8:  Tolerance = 1.528e-07
                      
                      GEE population-averaged model                        Number of obs    =     48
                      Group variable: parid                                Number of groups =     25
                      Family: Binomial                                     Obs per group:  
                      Link:   Logit                                                     min =      1
                      Correlation: exchangeable                                         avg =    1.9
                                                                                        max =      2
                                                                           Wald chi2(3)     =   5.19
                      Scale parameter = 1                                  Prob > chi2      = 0.1586
                      
                      -------------------------------------------------------------------------------
                                  y | Coefficient  Std. err.      z    P>|z|     [95% conf. interval]
                      --------------+----------------------------------------------------------------
                              1.did |   1.960446    1.97209     0.99   0.320    -1.904779    5.825672
                                    |
                              group |
                      Intervention  |  -.0511094   1.522471    -0.03   0.973    -3.035098    2.932879
                                    |
                               time |
                           Endline  |   .0165566   1.604845     0.01   0.992    -3.128881    3.161995
                              _cons |  -2.429842   1.145843    -2.12   0.034    -4.675653   -.1840306
                      -------------------------------------------------------------------------------
                      
                      .
                      . matrix b= r(table)["b", 1 ...]
                      
                      .
                      . mata: st_matrix("b", exp(st_matrix("b")))
                      
                      .
                      . mat colnames b= `:colnames e(b)'
                      
                      .
                      . mata: st_matrix("V", editmissing(diag(st_matrix("V")), 0))
                      
                      .
                      . erepost b=b, rename
                      
                      .
                      . erepost V=V, rename
                      
                      .
                      . etable
                      
                      -------------------------------
                                                 y  
                      -------------------------------
                      did                            
                        1                       7.102
                                             (14.007)
                      group                          
                        Intervention            0.950
                                              (1.447)
                      time                          
                        Endline                 1.017
                                              (1.632)
                      Intercept                 0.088
                                              (0.101)
                      Number of observations       48
                      -------------------------------

                      Comment


                      • #12
                        I had read that the interaction effect does not give the true ATET for interactions in logit models. The marginal effect approach was suggested on this thread https://www.statalist.org/forums/for...al#post1737357. There are other literatures which have also discussed the marginal effect approach. I then thought to do a replacement to allow me to present it in the same table with other coefficients.
                        Yes, the interaction odds ratio is, at best, controversial, as a measure of the ATET. While I personally think that this controversy is more semantic than substantive, I unequivocally agree that the marginal effect approach is superior. So far, we agree.

                        I then thought to do a replacement to allow me to present it in the same table with other coefficients.
                        But here is where I strongly disagree. The marginal effect is a completely different animal from both the coefficients and the odds ratios. And I argue that it should not be put in the same table (or at least, not in the same column of the same table) as either of those other things. I think it is, at best, confusing, and, at worst, misleading to do so. You present what, at first glance, looks like a table of odds ratios. And then, if you scrutnize it closely (and, actually, it means a close reading of the text that refers to the table), you suddenly find that one of those things is not like the others. That first "odds ratio" is some completely different thing. It can't be compared to the real odds ratios in the table. It can't be included in any calculation with the odds ratios. It simply does not belong.

                        I don't know what discipline your work is in, and standards vary from one field to another, and among journals within fields, and even among reviewers in journals. But I can say unequivocally that were I to be a reviewer on your manuscript, I would never let that get published that way. I would direct you to present the full table of odds ratios, and then separately present the marginal effect of your treatment.

                        Comment


                        • #13
                          Originally posted by Clyde Schechter View Post
                          Yes, the interaction odds ratio is, at best, controversial, as a measure of the ATET. While I personally think that this controversy is more semantic than substantive, I unequivocally agree that the marginal effect approach is superior. So far, we agree.


                          But here is where I strongly disagree. The marginal effect is a completely different animal from both the coefficients and the odds ratios. And I argue that it should not be put in the same table (or at least, not in the same column of the same table) as either of those other things. I think it is, at best, confusing, and, at worst, misleading to do so. You present what, at first glance, looks like a table of odds ratios. And then, if you scrutnize it closely (and, actually, it means a close reading of the text that refers to the table), you suddenly find that one of those things is not like the others. That first "odds ratio" is some completely different thing. It can't be compared to the real odds ratios in the table. It can't be included in any calculation with the odds ratios. It simply does not belong.

                          I don't know what discipline your work is in, and standards vary from one field to another, and among journals within fields, and even among reviewers in journals. But I can say unequivocally that were I to be a reviewer on your manuscript, I would never let that get published that way. I would direct you to present the full table of odds ratios, and then separately present the marginal effect of your treatment.
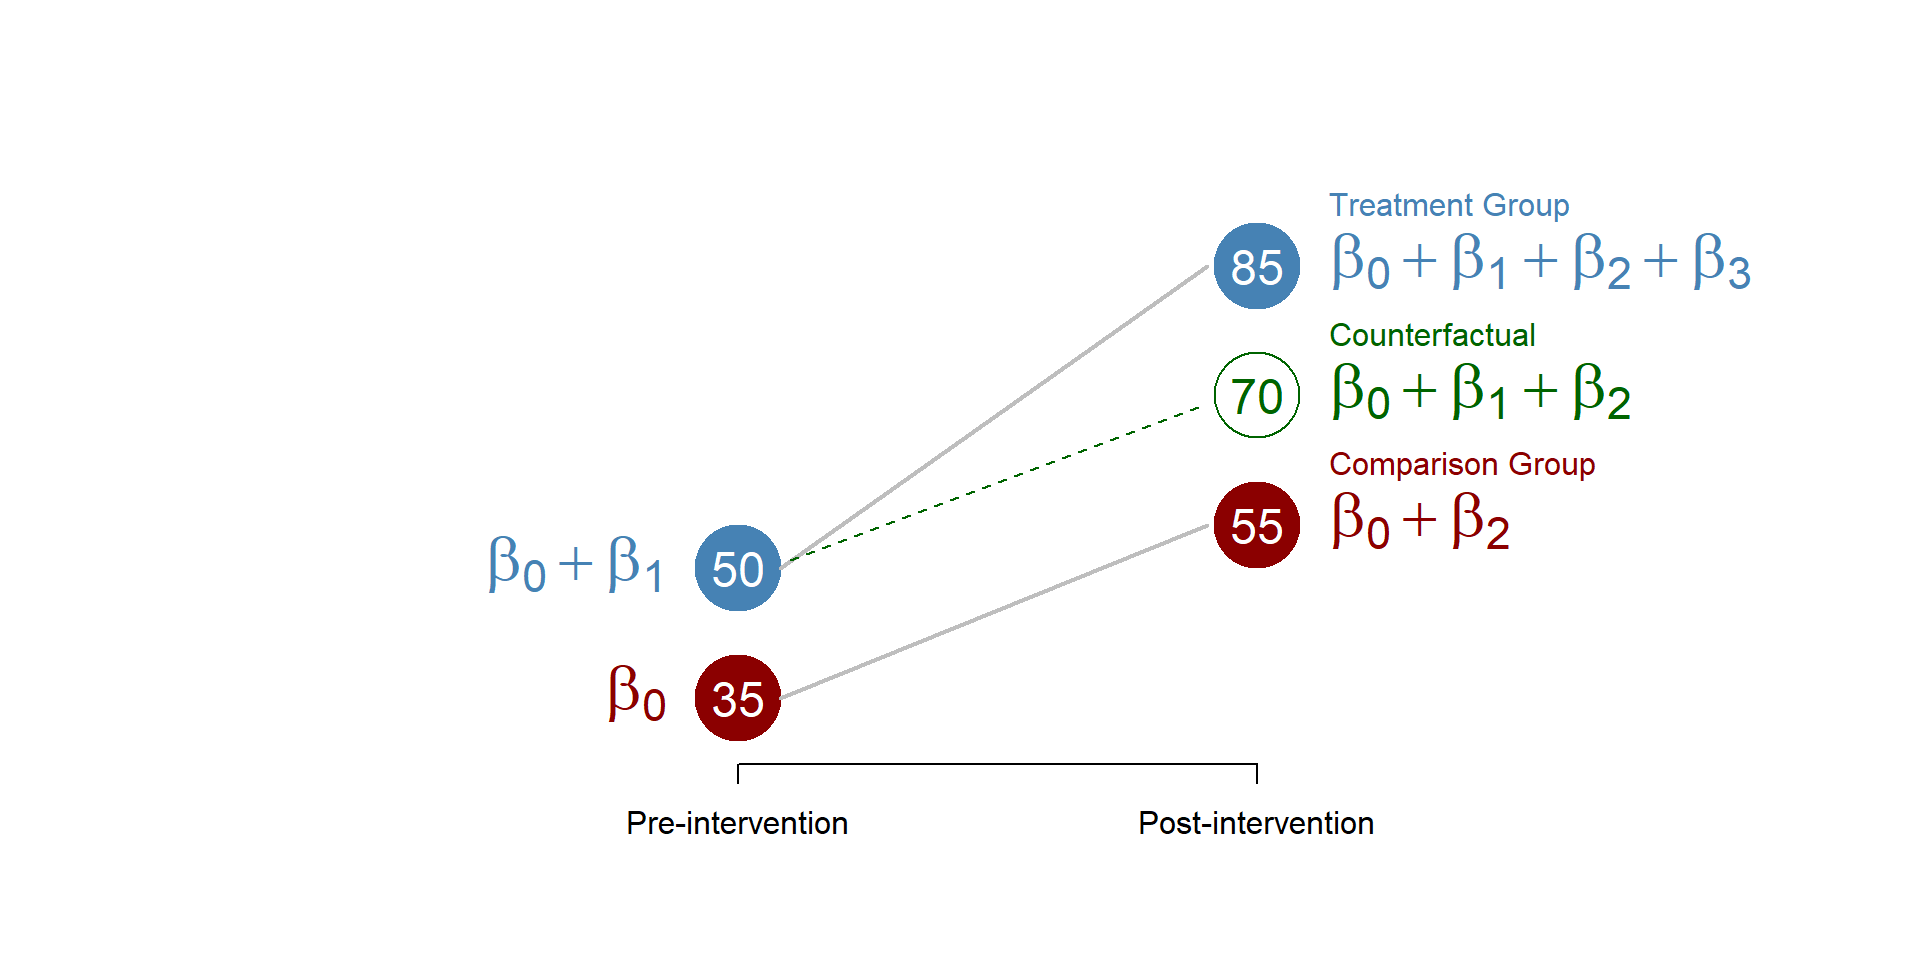
                          Thank you very much. I strongly agree with you. I will take this into consideration. However, in a case I am interested in coming up with something similar to the sample graph below, how would you advise I handle the DiD coefficient which is represented as "B3" in the graph, in the face of the marginal approach. Thank you.


                          Comment


                          • #14
                            [QUOTE=Andrew Musau;n1750205]Here is how you can replace e(b) and e(V) using erepost from SSC. Notice that I put the coefficients' and VCE matrix back into the estimation results after manipulation.

                            Code:
                            xtset parid
                            xtgee y i.did i.group i.time, family(binomial) link(logit) i(parid) t(time) eform
                            matrix V= r(table)["se", 1 ...]'*r(table)["se", 1 ...]
                            
                            *NOTE THAT THE LAST REGRESSION HAS NO -eform-
                            xtgee y i.did i.group i.time, family(binomial) link(logit) i(parid) t(time)
                            
                            matrix b= e(b)
                            mata: st_matrix("b", exp(st_matrix("b")))
                            mat colnames b= `:colnames e(b)'
                            
                            mata: st_matrix("V", editmissing(diag(st_matrix("V")), 0))
                            erepost b=b, rename
                            erepost V=V, rename
                            etable
                            Thank you for this. This is great. I would appreciate if you have any opinion on the other question raised above. Thank you for the assistance.

                            Comment


                            • #15
                              Re #13. I would put all the betas in the diagrams as coefficients, or all of them as odds ratios, whichever you prefer. I would then perhaps put a curly brace to the left of the circles holding the 85 and 70, and put the difference, 15, next to that and label it as the ATET.

                              Actually, I would also probably split the vertically and show the probability (as a percentage if you wish) in the left half of the circle and the odds (or the xb if you show coefficients) in the right half, clearly labeled as such. That way the beta 3 becomes the "effect" on the probabilities/odds that appear next to the betas on the right, and the ATET is adjacent to the probabilities (which is what it operates on.)
                              Last edited by Clyde Schechter; 16 Apr 2024, 19:55.

                              Comment

                              Working...
                              X