Announcement

Collapse
No announcement yet.
X
  • Filter
  • Time
  • Show
Clear All
new posts

  • How can I add different xlines to each country

    I am working on the Environmental Kuznets Curve, so I want to get graphs for all the countries within each region, like in the following code:

    graph twoway scatter co2 gdppc if latin_america==1, by(countryname) ytitle("CO2 emissions") xtitle("GDP per capita")
    However, I would like to add a xline for each country within the graph. I want this line to account for the year in which each country reached its industrialization peak. Since each country reached this point at a different year, I cannot establish a single xline. I have two variables for this: year_industrialized, which is simply the industrialization peak year, and year_dummy which equals 1 if year >= year_industrialized.

    I tried to run this:

    graph twoway scatter co2 gdppc if latin_america==1, by(countryname) ytitle("CO2 emissions") xtitle("GDP per capita") xline(year_industrialized)
    But I get this error:
    xline(year_industrialized) is not a twoway plot type
    How can I get these xlines for each country?

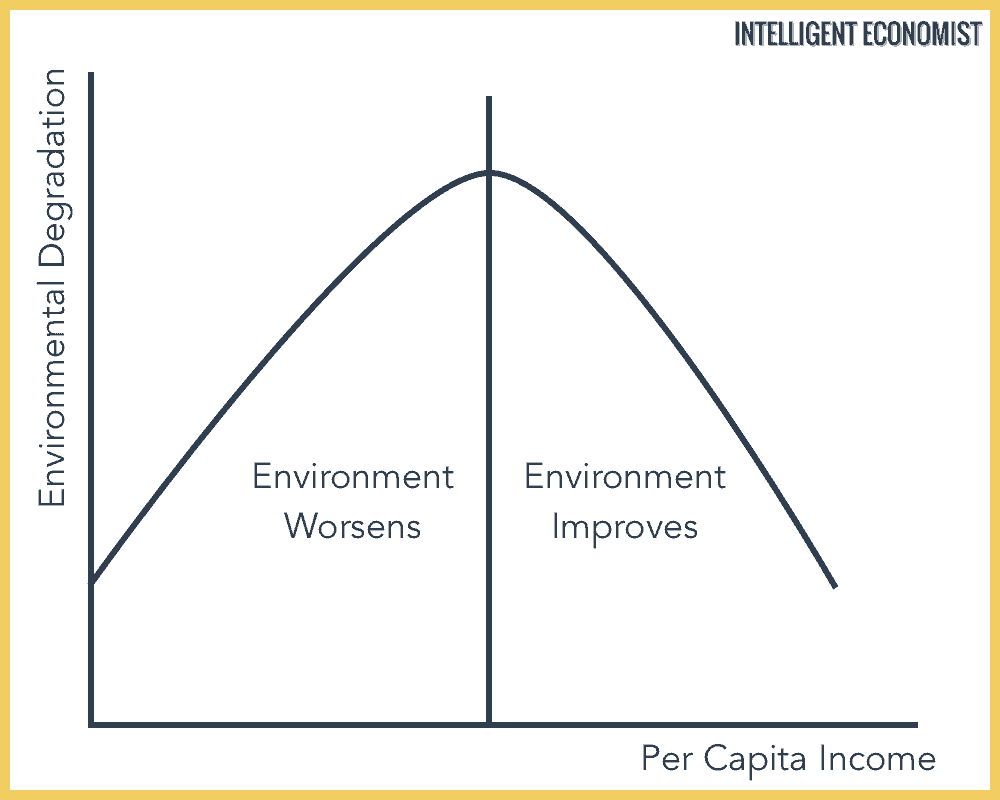
    For clarification, the picture below is what I aim to obtain: a line which represents the "turning point"


    This is a preview of my dataset:


    Code:
    * Example generated by -dataex-. To install: ssc install dataex
    clear
    input str18 countryname float co2 double gdppc int year str27 regionname float(latin_america year_industrialized year_dummy)
    "Argentina" 42100 8861 1960 "Latin America and Caribbean" 1 1976 0
    "Argentina" 44100 9344 1961 "Latin America and Caribbean" 1 1976 0
    "Argentina" 46300 9049 1962 "Latin America and Caribbean" 1 1976 0
    "Argentina" 43300 8695 1963 "Latin America and Caribbean" 1 1976 0
    "Argentina" 48100 9446 1964 "Latin America and Caribbean" 1 1976 0
    end
    Last edited by sladmin; 02 Mar 2024, 08:23. Reason: anonymize original poster

  • #2
    Your data example shows just one country, so is not ideal to show technique. I'd recommend using twoway spike to show vertical lines. You can run this script to get the idea.

    Code:
    webuse grunfeld, clear 
    
    bysort company : egen toshow = min(cond(invest > 50, year, .))
    
    su invest, meanonly 
    gen max = r(max)
    label var max "passed 50"
    
    twoway spike max toshow, lc(gs12) lw(thin) by(company) ysc(log) || line invest year

    Comment


    • #3

      Originally posted by Nick Cox View Post
      Your data example shows just one country, so is not ideal to show technique. I'd recommend using twoway spike to show vertical lines. You can run this script to get the idea.

      Code:
      webuse grunfeld, clear
      
      bysort company : egen toshow = min(cond(invest > 50, year, .))
      
      su invest, meanonly
      gen max = r(max)
      label var max "passed 50"
      
      twoway spike max toshow, lc(gs12) lw(thin) by(company) ysc(log) || line invest year

      First of all, thanks for your answer @NickCox.

      I created a dummy variable to relate the gdppc to the year_industrialized:

      Code:
      gen industrialized_gdppc = (year_industrialized == year) * gdppc
      This is an example which includes more countries:

      Code:
      * Example generated by -dataex-. To install: ssc install dataex
      clear
      input str18 countryname float co2 double gdppc int year str27 regionname float(latin_america year_industrialized year_dummy industrialized_gdppc)
      "Chile" 11200       6923 1961 "Latin America and Caribbean" 1 1974 0         0
      "Chile" 14000       7208 1965 "Latin America and Caribbean" 1 1974 0         0
      "Chile" 17900       6731 1975 "Latin America and Caribbean" 1 1974 1         0
      "Chile" 21000       9024 1980 "Latin America and Caribbean" 1 1974 1         0
      "Chile" 19200       8024 1985 "Latin America and Caribbean" 1 1974 1         0
      "Chile" 20500       8721 1987 "Latin America and Caribbean" 1 1974 1         0
      "Chile" 28600 10746.4916 1991 "Latin America and Caribbean" 1 1974 1         0
      "Chile" 52400 14846.4175 1999 "Latin America and Caribbean" 1 1974 1         0
      "Chile" 52400  17137.486 2005 "Latin America and Caribbean" 1 1974 1         0
      "Chile" 59900 18184.4814 2009 "Latin America and Caribbean" 1 1974 1         0
      "Chile" 81800      21589 2015 "Latin America and Caribbean" 1 1974 1         0
      "Haiti"   873  1628.7188 1991 "Latin America and Caribbean" 1 1996 0         0
      "Haiti"   612  1443.1808 1993 "Latin America and Caribbean" 1 1996 0         0
      "Haiti"  1030  1426.4126 1996 "Latin America and Caribbean" 1 1996 1 1426.4126
      "Haiti"  1330  1513.3318 1999 "Latin America and Caribbean" 1 1996 1         0
      end

      I tried to run the code you provided for my data, but if I run this, I get the following results:

      Code:
      graph twoway scatter co2 gdppc if latin_america==1, by(countryname) ytitle("CO2 emissions") xtitle("GDP per capita") || spike co2 industrialized_gdppc if latin_america==1
      Click image for larger version

Name:	image_30976.png
Views:	1
Size:	30.3 KB
ID:	1712696


      I only want the Latin American countries to appear here (I wrote "if latin_america==1" twice for this purpose) and I do not understand why I get two lines for most countries.
      Another question, is there a way to make these lines longer?
      Last edited by sladmin; 02 Mar 2024, 08:24. Reason: anonymize original poster

      Comment


      • #4
        You didn't do quite what I suggested.

        Each spike in my design has a y coordinate which is a height chosen to extend over most if not all of the vertical extent of the graph. It has an x coordinate. and that is correctly specified in your code. But you're supplying as y coordinate a dummy variable, so the spike has height 1 when it is visible -- except that it is in practice not visible as it is utterly dwarfed by the magnitudes of the carbon dioxide variable -- which in your data example go up to 435000, so 1 compared with 435000 is not a practical choice.

        You've other problems besides that named.

        * One in my suggestion is that the spikes be thin. They need to be stronger.

        * Another is easy. School chemistry demands a subscript 2 for carbon dioxide.

        * As in your example GDP pc can go down as well as up, a sort option seems needed if I understand the goal here, and I am not an economist.

        * You're mixing large and small countries, so either carbon dioxide is scaled by population too, or you need log scale for the graph to work reasonably.

        * It's not clear that alphabetical order has any virtue here. See e.g.. https://journals.sagepub.com/doi/pdf...6867X211045582 or https://journals.sagepub.com/doi/pdf...36867X20976341

        * The y axis labels are a mess.

        * The problem prescription in #1 is to draw one spike for each country, but your dummy variable is not defined as 1 for the first relevant date, but as 1 for that date and later. I didn't fix this.

        This code attends to some but not all of these problems.

        Code:
        * Example generated by -dataex-. To install: ssc install dataex
        clear
        input str18 countryname float co2 double gdppc int year str27 regionname float(latin_america year_industrialized year_dummy)
        "Brazil"  44700       3637 1964 "Latin America and Caribbean" 1 1984 0
        "Brazil" 177000  8166.2356 1993 "Latin America and Caribbean" 1 1984 1
        "Brazil" 296000 12500.0064 2007 "Latin America and Caribbean" 1 1984 1
        "Brazil" 298000 13180.8909 2009 "Latin America and Caribbean" 1 1984 1
        "Mexico"  41300       4723 1960 "Latin America and Caribbean" 1 2008 0
        "Mexico"  56100       5950 1966 "Latin America and Caribbean" 1 2008 0
        "Mexico" 272000       9699 1990 "Latin America and Caribbean" 1 2008 0
        "Mexico" 324000 11894.2028 1999 "Latin America and Caribbean" 1 2008 0
        "Mexico" 359000 13287.5999 2004 "Latin America and Caribbean" 1 2008 0
        "Mexico" 435000      16133 2016 "Latin America and Caribbean" 1 2008 1
        "Panama"   1970       3929 1964 "Latin America and Caribbean" 1 2019 0
        "Panama"   2590       7578 1986 "Latin America and Caribbean" 1 2019 0
        "Panama"   2440       6715 1989 "Latin America and Caribbean" 1 2019 0
        "Panama"   5290  9784.6941 1999 "Latin America and Caribbean" 1 2019 0
        end
        
        su co2, meanonly
        gen max = r(max)
        
        label var co2 "CO{sub:2}"
        label var max `" "better wording" "needed" "'
        
        twoway spike max gdppc if year_dummy, lc(gs12) lw(medium) by(countryname, note("")) || line co2 gdppc, sort ysc(log) yla(1000 10000 100000, ang(h))

        Click image for larger version

Name:	kuznets.png
Views:	1
Size:	29.7 KB
ID:	1712705

        Comment


        • #5
          Originally posted by Nick Cox View Post
          You didn't do quite what I suggested.

          Each spike in my design has a y coordinate which is a height chosen to extend over most if not all of the vertical extent of the graph. It has an x coordinate. and that is correctly specified in your code. But you're supplying as y coordinate a dummy variable, so the spike has height 1 when it is visible -- except that it is in practice not visible as it is utterly dwarfed by the magnitudes of the carbon dioxide variable -- which in your data example go up to 435000, so 1 compared with 435000 is not a practical choice.

          You've other problems besides that named.

          * One in my suggestion is that the spikes be thin. They need to be stronger.

          * Another is easy. School chemistry demands a subscript 2 for carbon dioxide.

          * As in your example GDP pc can go down as well as up, a sort option seems needed if I understand the goal here, and I am not an economist.

          * You're mixing large and small countries, so either carbon dioxide is scaled by population too, or you need log scale for the graph to work reasonably.

          * It's not clear that alphabetical order has any virtue here. See e.g.. https://journals.sagepub.com/doi/pdf...6867X211045582 or https://journals.sagepub.com/doi/pdf...36867X20976341

          * The y axis labels are a mess.

          * The problem prescription in #1 is to draw one spike for each country, but your dummy variable is not defined as 1 for the first relevant date, but as 1 for that date and later. I didn't fix this.

          This code attends to some but not all of these problems.

          Code:
          * Example generated by -dataex-. To install: ssc install dataex
          clear
          input str18 countryname float co2 double gdppc int year str27 regionname float(latin_america year_industrialized year_dummy)
          "Brazil" 44700 3637 1964 "Latin America and Caribbean" 1 1984 0
          "Brazil" 177000 8166.2356 1993 "Latin America and Caribbean" 1 1984 1
          "Brazil" 296000 12500.0064 2007 "Latin America and Caribbean" 1 1984 1
          "Brazil" 298000 13180.8909 2009 "Latin America and Caribbean" 1 1984 1
          "Mexico" 41300 4723 1960 "Latin America and Caribbean" 1 2008 0
          "Mexico" 56100 5950 1966 "Latin America and Caribbean" 1 2008 0
          "Mexico" 272000 9699 1990 "Latin America and Caribbean" 1 2008 0
          "Mexico" 324000 11894.2028 1999 "Latin America and Caribbean" 1 2008 0
          "Mexico" 359000 13287.5999 2004 "Latin America and Caribbean" 1 2008 0
          "Mexico" 435000 16133 2016 "Latin America and Caribbean" 1 2008 1
          "Panama" 1970 3929 1964 "Latin America and Caribbean" 1 2019 0
          "Panama" 2590 7578 1986 "Latin America and Caribbean" 1 2019 0
          "Panama" 2440 6715 1989 "Latin America and Caribbean" 1 2019 0
          "Panama" 5290 9784.6941 1999 "Latin America and Caribbean" 1 2019 0
          end
          
          su co2, meanonly
          gen max = r(max)
          
          label var co2 "CO{sub:2}"
          label var max `" "better wording" "needed" "'
          
          twoway spike max gdppc if year_dummy, lc(gs12) lw(medium) by(countryname, note("")) || line co2 gdppc, sort ysc(log) yla(1000 10000 100000, ang(h))

          [ATTACH=CONFIG]n1712705[/ATTACH]

          This is the result I obtain after following your code. (Except that I used "industrialized_gdppc" instead of "year_dummy").
          Click image for larger version

Name:	Graph.png
Views:	1
Size:	74.4 KB
ID:	1712713


          I have two questions:

          - Why do I get these three horizontal lines? How can I remove them?

          - How can I remove the countries that are not from Latin America? (I know that I am missing data for many Asian countries, I need to work on that but thats not a problem now because I only want to have Latin America countries in my graph)
          Last edited by sladmin; 02 Mar 2024, 08:24. Reason: anonymize original poster

          Comment


          • #6
            You are using scheme s2color which I recommend against.

            I think you are not using Stata 18: it helps to be told that.

            If you don't have access to 18, that is fine, but

            Code:
            set scheme s1color
            is then a better default (and there is much advice from people who think there is an even better default).

            The horizontal lines are grid lines which you suppress with yla(, nogrid)

            If I understand the data correctly you need to specify

            Code:
            if latin_america == 1
            on each part of the graph command. just as you did in #1.

            If that doesn't work you need brute force


            Code:
            preserve 
            
            keep if latin_america == 1 
            
            * graphics here 
            
            restore

            Comment


            • #7
              Originally posted by Nick Cox View Post
              You are using scheme s2color which I recommend against.

              I think you are not using Stata 18: it helps to be told that.

              If you don't have access to 18, that is fine, but

              Code:
              set scheme s1color
              is then a better default (and there is much advice from people who think there is an even better default).

              The horizontal lines are grid lines which you suppress with yla(, nogrid)

              If I understand the data correctly you need to specify

              Code:
              if latin_america == 1
              on each part of the graph command. just as you did in #1.

              If that doesn't work you need brute force


              Code:
              preserve
              
              keep if latin_america == 1
              
              * graphics here
              
              restore
              Thanks so much for your help, I really appreciate it. I managed to obtain the graph the way I wanted it, although the scale does not 100% convince me but I guess that it is the way it is supposed to look after including all these countries.

              Comment


              • #8
                Originally posted by Nick Cox View Post
                You are using scheme s2color which I recommend against.

                I think you are not using Stata 18: it helps to be told that.

                If you don't have access to 18, that is fine, but

                Code:
                set scheme s1color
                is then a better default (and there is much advice from people who think there is an even better default).

                The horizontal lines are grid lines which you suppress with yla(, nogrid)

                If I understand the data correctly you need to specify

                Code:
                if latin_america == 1
                on each part of the graph command. just as you did in #1.

                If that doesn't work you need brute force


                Code:
                preserve
                
                keep if latin_america == 1
                
                * graphics here
                
                restore
                Thanks so much for your help, I really appreciate it. I managed to obtain the graph the way I wanted it, although the scale does not 100% convince me... is there a way to make each country have its own scale?

                Comment


                • #9
                  Thanks for the thanks. There is no need to quote the entirety of a previous post; the point about quotation is that you can be selective. As now:

                  is there a way to make each country have its own scale?
                  Surely. See help by option for the yrescale suboption

                  Comment

                  Working...
                  X