Dear all,
I would like to impose some restrictions on an estimated SVAR before running impulse response function, by following the work by Ludvigson et al. (2002, Monetary Policy Transmission through the Consumption-Wealth Channel. FRBNY Economic Policy Review,117-133.)
I am using Stata 15.1 for Windows.
By following this tutorial and using the dataset, I have estimated a Structural VAR:
Ayt = C1yt-1 + C2yt-2 ... Ckyt-k + But
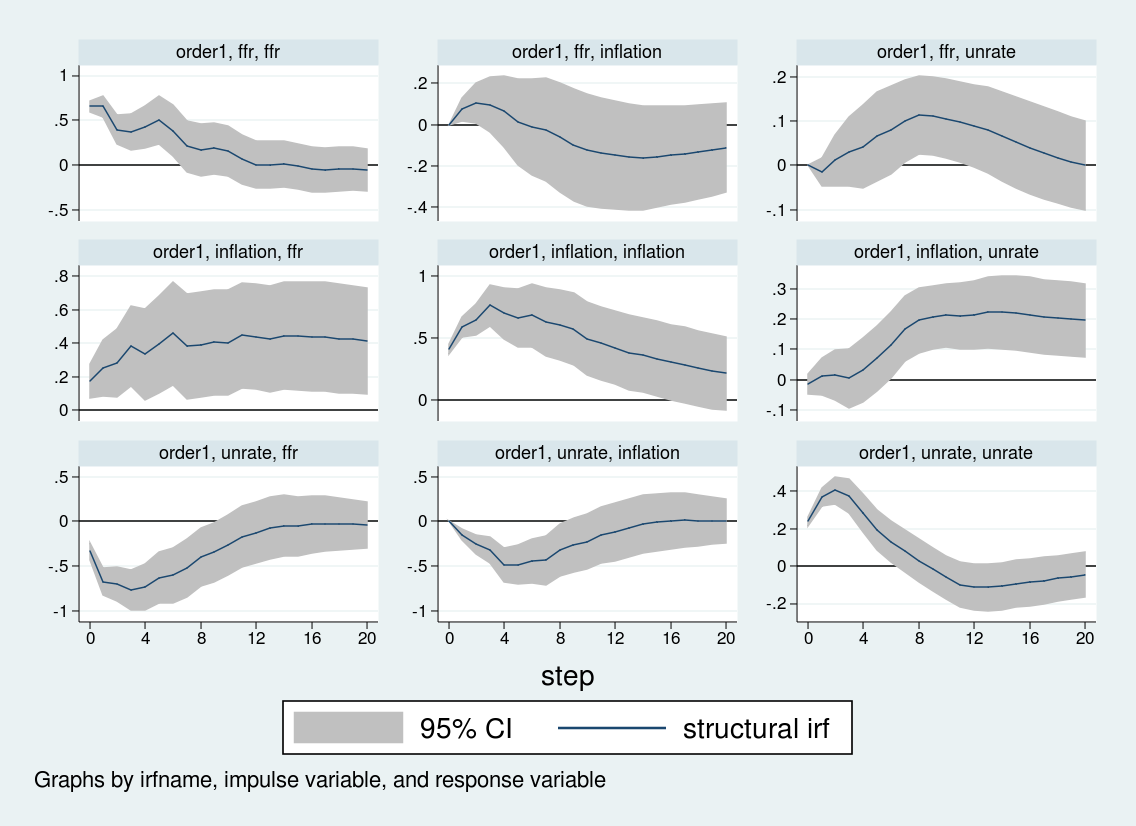
And the figure below shows the impulse response function based on the SVAR estimated above.
Now, I want to perform another impulse response analysis on the estimated Structural VAR by imposing some restrictions on the matrices C0 to Ck. For instance, I want to set c23 = 0 in matrices C0 to Ck to econometrically turn off the effects of the contemporaneous response of the unemployment rate to the federal funds rate, as well as any lagged response of the unemployment rate to the federal funds rate.
Based on this restricted SVAR, I would like to perform impulse response analysis to see the response of inflation rate against a shock in the federal funds rate.
There was a similar discussion about this previously on Statalist, but it seems that no direct solutions were provided.
Is there any way to do this on Stata?
Thank you very much for your help in advance.
Daiki
I would like to impose some restrictions on an estimated SVAR before running impulse response function, by following the work by Ludvigson et al. (2002, Monetary Policy Transmission through the Consumption-Wealth Channel. FRBNY Economic Policy Review,117-133.)
I am using Stata 15.1 for Windows.
By following this tutorial and using the dataset, I have estimated a Structural VAR:
Ayt = C1yt-1 + C2yt-2 ... Ckyt-k + But
Code:
use usmacro.dta

matrix A1 = (1,0,0 \ .,1,0 \ .,.,1)

matrix B1 = (.,0,0 \ 0,.,0 \ 0,0,.)

svar inflation unrate ffr, lags(1/6) aeq(A1) beq(B1)
Estimating short-run parameters

Iteration 0:   log likelihood = -708.74354
Iteration 1:   log likelihood = -443.10177
Iteration 2:   log likelihood = -354.17943
Iteration 3:   log likelihood = -303.90081
Iteration 4:   log likelihood =  -299.0338
Iteration 5:   log likelihood = -298.87521
Iteration 6:   log likelihood = -298.87514
Iteration 7:   log likelihood = -298.87514

Structural vector autoregression

 ( 1)  [a_1_1]_cons = 1
 ( 2)  [a_1_2]_cons = 0
 ( 3)  [a_1_3]_cons = 0
 ( 4)  [a_2_2]_cons = 1
 ( 5)  [a_2_3]_cons = 0
 ( 6)  [a_3_3]_cons = 1
 ( 7)  [b_1_2]_cons = 0
 ( 8)  [b_1_3]_cons = 0
 ( 9)  [b_2_1]_cons = 0
 (10)  [b_2_3]_cons = 0
 (11)  [b_3_1]_cons = 0
 (12)  [b_3_2]_cons = 0

Sample:  39 - 236                               Number of obs     =        198
Exactly identified model                        Log likelihood    =  -298.8751

------------------------------------------------------------------------------
             |      Coef.   Std. Err.      z    P>|z|     [95% Conf. Interval]
-------------+----------------------------------------------------------------
      /a_1_1 |          1  (constrained)
      /a_2_1 |   .0348406   .0416245     0.84   0.403     -.046742    .1164232
      /a_3_1 |  -.3777114    .113989    -3.31   0.001    -.6011257   -.1542971
      /a_1_2 |          0  (constrained)
      /a_2_2 |          1  (constrained)
      /a_3_2 |   1.402087   .1942736     7.22   0.000     1.021318    1.782857
      /a_1_3 |          0  (constrained)
      /a_2_3 |          0  (constrained)
      /a_3_3 |          1  (constrained)
-------------+----------------------------------------------------------------
      /b_1_1 |   .4088627   .0205461    19.90   0.000     .3685931    .4491324
      /b_2_1 |          0  (constrained)
      /b_3_1 |          0  (constrained)
      /b_1_2 |          0  (constrained)
      /b_2_2 |   .2394747   .0120341    19.90   0.000     .2158884     .263061
      /b_3_2 |          0  (constrained)
      /b_1_3 |          0  (constrained)
      /b_2_3 |          0  (constrained)
      /b_3_3 |   .6546452   .0328972    19.90   0.000     .5901679    .7191224
------------------------------------------------------------------------------

irf create order1, set(var2.irf) replace step(20)

irf graph sirf, xlabel(0(4)20) irf(order1) yline(0,lcolor(black)) byopts(yrescale)
Now, I want to perform another impulse response analysis on the estimated Structural VAR by imposing some restrictions on the matrices C0 to Ck. For instance, I want to set c23 = 0 in matrices C0 to Ck to econometrically turn off the effects of the contemporaneous response of the unemployment rate to the federal funds rate, as well as any lagged response of the unemployment rate to the federal funds rate.
Based on this restricted SVAR, I would like to perform impulse response analysis to see the response of inflation rate against a shock in the federal funds rate.
There was a similar discussion about this previously on Statalist, but it seems that no direct solutions were provided.
Is there any way to do this on Stata?
Thank you very much for your help in advance.
Daiki