Announcement

Collapse
No announcement yet.
X
  • Filter
  • Time
  • Show
Clear All
new posts

  • labels using VennDiagram

    Hi,

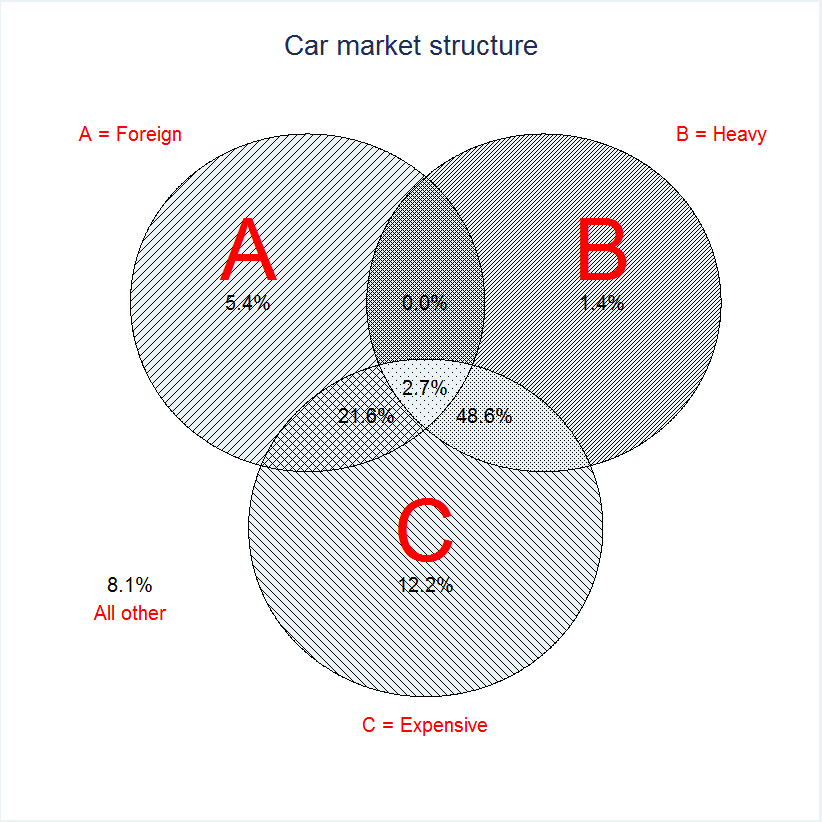
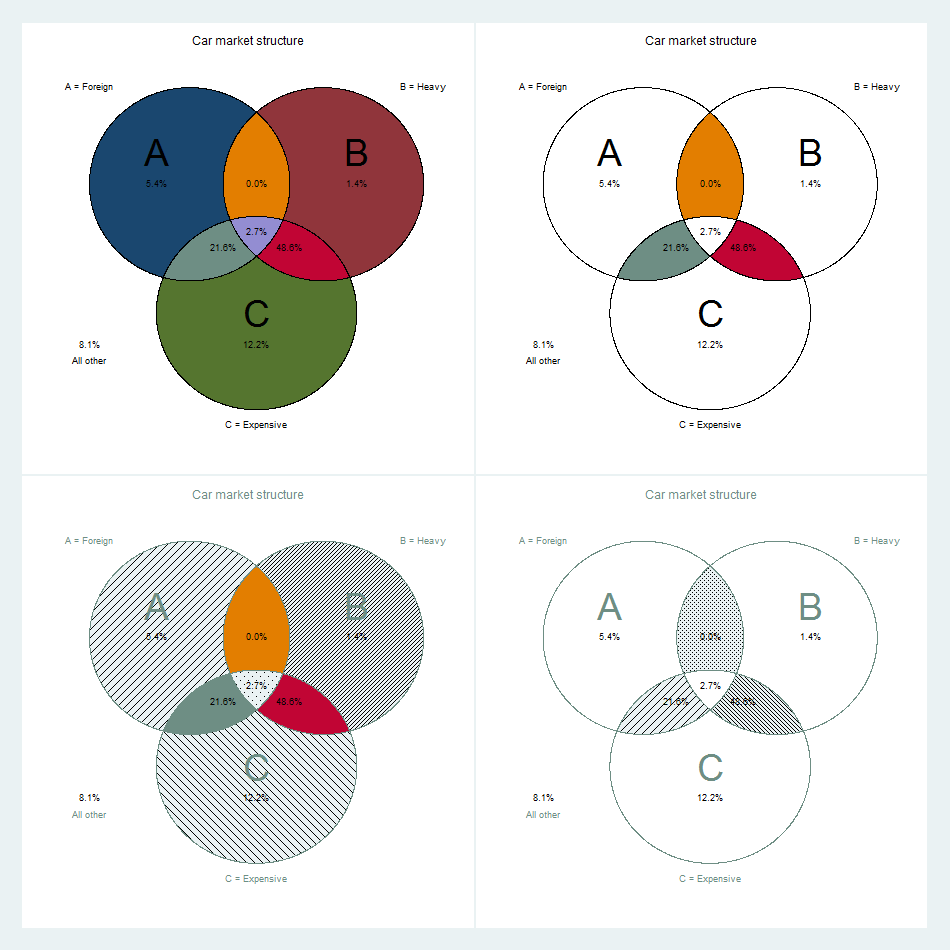
    I am using a user defined command VennDiagram to draw a venn diagram. Can the command VennDiagram make the labels to be adjacent to the circles?
    Thanks in advance!

    Best,

    Stephen.

  • #2
    Yes, Stephen, this is a good question. If you need to comment something on the chart, just add a text where necessary, see this example:
    Code:
    do http://www.radyakin.org/stata/venndiagram/venndemo_labels.do
    This should produce the following:


    Best, Sergiy Radyakin

    Comment


    • #3
      Thanks Sergiy. This is really awesome.

      Comment


      • #4
        Sergiy Radyakin What if I want to do away with the lines in the background of the circles?
        Last edited by Stephen Okiya; 13 Dec 2018, 01:44.

        Comment


        • #5
          The whole point of VennDiagram was to make specifically patterned representation of overlaps.

          I have made some adjustments to make colored or mixed presentations and will let Stephen check it out:

          Comment


          • #6
            Thanks Sergiy Radyakin for the extra efforts in modifying the ado file. I will try it out and give you feedback.

            Comment


            • #7
              Hello everyone!

              How can I use this command venndiag to have a white background? I see that by default it only shows a black background. It's there a way to change it?

              Thanks a lot!

              Luciana

              Comment


              • #8
                Hello Luciana,

                the images above show that it is possible. At least that should be true by default.
                But since your 'default' is different from my 'default', there must be something else involved.

                Try to run an example from the venndiagram homepage and post the result if you have it rendered differently with details about your version and settings.

                Best, Sergiy

                Comment


                • #9
                  I have Stata version 14, I can't run the program that you posted. My command venndiagram doesn't accept neither "tittle" nor "text".


                  VennDiagram foreign heavy expensive, title("Car market structure") /// legend(off) /// text(9000 6000 "All other" , color(`color')) /// text(26000 6000 "A = Foreign", color(`color')) /// text(26000 26000 "B = Heavy", color(`color')) /// text(5000 16000 "C = Expensive", color(`color')) /// text(22000 10000 "A", color(`color') size(`size')) /// text(22000 22000 "B", color(`color') size(`size')) /// text(12000 16000 "C", color(`color') size(`size'))

                  I have run something like that, and it shows me a diagram that is adjointed with black background: venndiag x y z, show(l p c ) thick(112)


                  Click image for larger version

Name:	DiagVenn2018.png
Views:	1
Size:	18.9 KB
ID:	1551325


                  Comment


                  • #10
                    After a sleepless night and fruitless attempts to reproduce your problem, I have realized that you are probably using a different command: venndiag and VennDiagram are not the same.
                    "I have run something like that" is not a very precise description of what you've done.

                    Comment


                    • #11
                      Hi Sergiy,

                      I have run this:

                      Code:
                      venndiag x y z, show(l p c ) thick(112)
                      using the command venndiag. My Stata 14 doesn´t allow me to use VennDiagram, it says that it doesn't exist, any ideas about what could happen?

                      It shows:

                      Code:
                      command VennDiagram is unrecognized
                      r(199)
                      Last edited by Luciana Pando; 08 May 2020, 16:24.

                      Comment


                      • #12
                        Originally posted by Sergiy Radyakin View Post
                        The whole point of VennDiagram was to make specifically patterned representation of overlaps.

                        I have made some adjustments to make colored or mixed presentations and will let Stephen check it out:

                        Good morning Sergiy Radyakin, I am trying to use the command "VennDiagram" and I followed your instructions here, where I managed to successfully install "twoway_parea" but I am not able to install the subsequent package "vdiagram" as the page http://www.radyakin.org/stata/venndiagram return me an error message, a "Forbidden - Error 403" blank page.

                        Could you kindly help me understand where and how I can install the remaining part of the "VennDiagram" package?

                        Thanks.

                        Comment


                        • #13
                          On a different level I fail to see how the displays in #12 would help anyone much. even as a visualization. For example, the areas of subsets bear no relation to their frequency. A plain table would be clearer.

                          upsetplot and vennbar from SSC are alternatives. See e.g. https://www.statalist.org/forums/for...lable-from-ssc

                          Comment


                          • #14
                            Thanks for the interest and the suggestion Nick Cox, but I need Venn diagrams for my work, not bar carts. Hoping Sergiy Radyakin have a solution to the problem I am encountering.

                            Comment


                            • #15
                              Your choice!

                              Comment

                              Working...
                              X