Announcement

Collapse
No announcement yet.
X
  • Filter
  • Time
  • Show
Clear All
new posts

  • Rolling-window and recursive estimation and forecasting

    Hello everyone
    I need your help
    I understand what is rolling and recursive estimation and I used in my computer.

    My question is how can I forecast dependent variable with this methods?

    When I used "predict"

    predict dln_inv

    stata said that

    last estimates not found


    My code:


    webuse lutkepohl2
    tsset qtr
    rolling _b, window(30) clear : regress dln_inv dln_inc dln_consump


    list in 1/10, abbrev(14)
    +-----------------------------------------------------------+
    start end _b_dln_inc _b_dln_consump _b_cons
    -----------------------------------------------------------
    1. 1960q1 1967q2 .1054375 1.263474 -.0101802
    2. 1960q2 1967q3 .1542573 1.251464 -.0113987
    3. 1960q3 1967q4 .2400457 1.001518 -.0048182
    4. 1960q4 1968q1 .0053584 1.202571 -.0067967
    5. 1961q1 1968q2 .012656 1.187025 -.006777
    -----------------------------------------------------------
    6. 1961q2 1968q3 -.0790168 1.094311 -.0048056
    7. 1961q3 1968q4 .0205408 .964076 -.0018992
    8. 1961q4 1969q1 -.1895722 1.169699 -.0022988
    9. 1962q1 1969q2 -.2074511 1.271727 -.002647
    10. 1962q2 1969q3 -.0170991 1.187241 -.0051391

    Thanks

  • #2
    Try the example in the Stata docs (page 7):

    http://www.stata.com/manuals13/tsrolling.pdf

    I found it very helpful when I had to do the same thing. Here's a snippet:

    Code:
    program myforecast, rclass
        syntax [if]
        regress ibm L.ibm L.spx ‘if’
        // Find last time period of estimation sample and
        // make forecast for period just after that
        summ t if e(sample)
        local last = r(max)
        local fcast = _b[_cons] + _b[L.ibm]*ibm[‘last’] + ///
                                                 _b[L.spx]*spx[‘last’]
        return scalar forecast = ‘fcast’
        // Next period’s actual return
        // Will return missing value for final period
        return scalar actual = ibm[‘last’+1]
    end
    Then using this program you incorporate into "rolling":

    Code:
    rolling actual=r(actual) forecast=r(forecast), recursive window(20): myforecast
    So this creates the vars "actual" and "forecast" which can you use to compare.

    Obviously you can adjust the parameters and such to meet your specifications.

    Comment


    • #3
      Here's a much more efficient way to perform a rolling regression with a recursive window using rangestat (from SSC). See my earlier post today for an example with a fixed window and with panel data. The following replicates the results from example 3 on page 7 of http://www.stata.com/manuals13/tsrolling.pdf:

      Code:
      clear all
      
      * --------- basic regression mata code: DO NOT CHANGE CODE BELOW ---------------
      * linear regression in Mata using quadcross() - help mata cross(), example 2
      mata:
      mata clear
      mata set matastrict on
      real rowvector myreg(real matrix Xall)
      {
          real colvector y, b, Xy
          real matrix X, XX
      
          y = Xall[.,1]                // dependent var is first column of Xall
          X = Xall[.,2::cols(Xall)]    // the remaining cols are the independent variables
          X = X,J(rows(X),1,1)         // add a constant
          
          XX = quadcross(X, X)        // linear regression, see help mata cross(), example 2
          Xy = quadcross(X, y)
          b  = invsym(XX) * Xy
          
          return(rows(X), b')
      }
      end
      * --------- end of basic regression mata code: DO NOT CHANGE CODE ABOVE --------
      
      * replicate http://www.stata.com/manuals13/tsrolling.pdf, example 3, p. 7
      use http://www.stata-press.com/data/r13/ibm, clear
      tsset t
      gen double L_ibm = L.ibm
      gen double L_spx = L.spx
      
      * for each observation, the sample starts with the first observation
      * and ends at the current observation.
      sum t
      gen low = r(min)
      rangestat (myreg) ibm L_ibm L_spx, interval(t low 0) casewise
      rename myreg* (obs b_L_ibm_Return b_L_spx b_cons)
      
      * limit results to t >= 20
      gen forecast0 = b_cons + b_L_ibm_Return * ibm + b_L_spx * spx if t >= 20
      gen actual0 = F.ibm if t >= 20
      corr actual0 forecast0
      save "rangestat_results.dta", replace
      
      * repeat using the manual's code on page 7
      program myforecast, rclass
          syntax [if]
          regress ibm L.ibm L.spx `if'
          // Find last time period of estimation sample and
          // make forecast for period just after that
          summ t if e(sample)
          local last = r(max)
          local fcast = _b[_cons] + _b[L.ibm]*ibm[`last'] + ///
                        _b[L.spx]*spx[`last']
          return scalar forecast = `fcast'
          // Next period’s actual return
          // Will return missing value for final period
          return scalar actual = ibm[`last'+1]
      end
      
      rolling actual=r(actual) forecast=r(forecast), recursive window(20): myforecast
      corr actual forecast
      
      * combine the rolling results with the original data plus rangestat results
      rename end t
      merge 1:1 t using "rangestat_results.dta", assert(match using) nogen
      sort t
      
      * show that the results match
      gen dforecast = abs(forecast0 - forecast)
      gen dactual = abs(actual0 - actual)
      sum dforecast dactual

      Comment


      • #4
        Originally posted by Chris Engel View Post
        Try the example in the Stata docs (page 7):

        http://www.stata.com/manuals13/tsrolling.pdf

        I found it very helpful when I had to do the same thing. Here's a snippet:

        Code:
        program myforecast, rclass
        syntax [if]
        regress ibm L.ibm L.spx ‘if’
        // Find last time period of estimation sample and
        // make forecast for period just after that
        summ t if e(sample)
        local last = r(max)
        local fcast = _b[_cons] + _b[L.ibm]*ibm[‘last’] + ///
        _b[L.spx]*spx[‘last’]
        return scalar forecast = ‘fcast’
        // Next period’s actual return
        // Will return missing value for final period
        return scalar actual = ibm[‘last’+1]
        end
        Then using this program you incorporate into "rolling":

        Code:
        rolling actual=r(actual) forecast=r(forecast), recursive window(20): myforecast
        So this creates the vars "actual" and "forecast" which can you use to compare.

        Obviously you can adjust the parameters and such to meet your specifications.
        Dear Chris

        . rolling actual=r(actual) forecast=r(forecast), recursive window(20): myforecast
        (running myforecast on estimation sample)
        ‘if’ invalid name
        an error occurred when rolling executed myforecast
        r(198);

        Can you send me your working file ? or only log?

        Comment


        • #5
          Originally posted by Robert Picard View Post
          Here's a much more efficient way to perform a rolling regression with a recursive window using rangestat (from SSC). See my earlier post today for an example with a fixed window and with panel data. The following replicates the results from example 3 on page 7 of http://www.stata.com/manuals13/tsrolling.pdf:

          Code:
          clear all
          
          * --------- basic regression mata code: DO NOT CHANGE CODE BELOW ---------------
          * linear regression in Mata using quadcross() - help mata cross(), example 2
          mata:
          mata clear
          mata set matastrict on
          real rowvector myreg(real matrix Xall)
          {
          real colvector y, b, Xy
          real matrix X, XX
          
          y = Xall[.,1] // dependent var is first column of Xall
          X = Xall[.,2::cols(Xall)] // the remaining cols are the independent variables
          X = X,J(rows(X),1,1) // add a constant
          
          XX = quadcross(X, X) // linear regression, see help mata cross(), example 2
          Xy = quadcross(X, y)
          b = invsym(XX) * Xy
          
          return(rows(X), b')
          }
          end
          * --------- end of basic regression mata code: DO NOT CHANGE CODE ABOVE --------
          
          * replicate http://www.stata.com/manuals13/tsrolling.pdf, example 3, p. 7
          use http://www.stata-press.com/data/r13/ibm, clear
          tsset t
          gen double L_ibm = L.ibm
          gen double L_spx = L.spx
          
          * for each observation, the sample starts with the first observation
          * and ends at the current observation.
          sum t
          gen low = r(min)
          rangestat (myreg) ibm L_ibm L_spx, interval(t low 0) casewise
          rename myreg* (obs b_L_ibm_Return b_L_spx b_cons)
          
          * limit results to t >= 20
          gen forecast0 = b_cons + b_L_ibm_Return * ibm + b_L_spx * spx if t >= 20
          gen actual0 = F.ibm if t >= 20
          corr actual0 forecast0
          save "rangestat_results.dta", replace
          
          * repeat using the manual's code on page 7
          program myforecast, rclass
          syntax [if]
          regress ibm L.ibm L.spx `if'
          // Find last time period of estimation sample and
          // make forecast for period just after that
          summ t if e(sample)
          local last = r(max)
          local fcast = _b[_cons] + _b[L.ibm]*ibm[`last'] + ///
          _b[L.spx]*spx[`last']
          return scalar forecast = `fcast'
          // Next period’s actual return
          // Will return missing value for final period
          return scalar actual = ibm[`last'+1]
          end
          
          rolling actual=r(actual) forecast=r(forecast), recursive window(20): myforecast
          corr actual forecast
          
          * combine the rolling results with the original data plus rangestat results
          rename end t
          merge 1:1 t using "rangestat_results.dta", assert(match using) nogen
          sort t
          
          * show that the results match
          gen dforecast = abs(forecast0 - forecast)
          gen dactual = abs(actual0 - actual)
          sum dforecast dactual
          Dear Robert

          y = Xall[.,1] // dependent var is first column of Xall
          invalid expression
          Last edited by ispanyol; 16 Mar 2017, 14:21.

          Comment


          • #6
            I want to ask you about forecasting strategies.

            There is 2 or 3 out-of sample forecasting methods?


            Prof. Zivot said that there is 2 methods (rolling and recursive)

            https://faculty.washington.edu/ezivo...evaluation.pdf


            Prof. West said that there is 3 methods (fixed, rolling and recursive)(page 107)

            http://www.ssc.wisc.edu/~kwest/publi...Evaluation.pdf


            1----When we use Stata for forecasting, which method we use?

            2---Do you have any add-on/codes for these methods for Stata ?

            Sincerely

            Comment


            • #7
              Re #5: You need to copy the code into a do-file and run it as a whole.

              Re #6: Above my pay grade.

              Comment


              • #8
                Dear Robert
                Can you modify your codes according to following ?

                Comment


                • #9
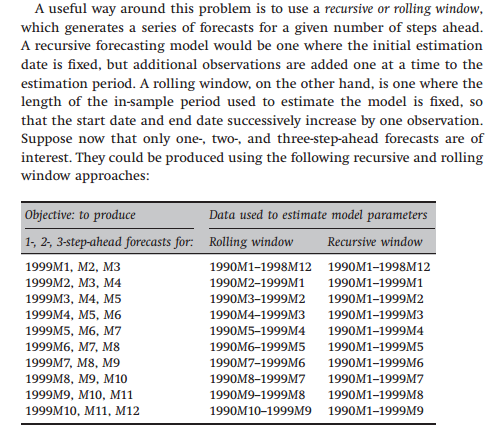
                  You are not trying very hard, you have a fully functioning example to work with. As the picture you posted shows, the only difference between a rolling window and a recursive (rolling) window is the start period.

                  It's important to understand that in both rolling and recursive windows, time moves ahead by one period. This means that you have to estimate the model at each period. Before you try to put together a complete solution, you should be able to write down the code that will do what you want for a specific window sample. Say we use the period in observation 50 as the end period for the window. The following, inspired by what you showed in #1, estimate the model using a recursive window that starts at the first observation and ends in the quarter of the 50th observation. The code predicts the value of the dependent variable for the 50th observation and makes out of sample predictions for the next 3 quarters using the estimated coefficients. I show how to do this using Stata's predict command and also how to calculate these manually
                  Code:
                  webuse lutkepohl2, clear
                  tsset qtr
                  
                  * window bounds for a recursive window that end at the 50th observation
                  list qtr in 1
                  list qtr in 50
                  
                  * estimate model
                  regress dln_inv dln_inc dln_consump if qtr <= qtr[50]
                  
                  * predict the 50th observation and forecast the next 3
                  predict xb
                  list qtr xb in 50/53
                  
                  * predict and forecast manually
                  dis _b[_cons] + _b[dln_inc]*dln_inc[50] + _b[dln_consump]*dln_consump[50]
                  dis _b[_cons] + _b[dln_inc]*dln_inc[51] + _b[dln_consump]*dln_consump[51]
                  dis _b[_cons] + _b[dln_inc]*dln_inc[52] + _b[dln_consump]*dln_consump[52]
                  dis _b[_cons] + _b[dln_inc]*dln_inc[53] + _b[dln_consump]*dln_consump[53]
                  If you want to use a rolling window instead, the only thing that changes is the start of the window. Let's say that the rolling window should include 5 quarters:
                  Code:
                  webuse lutkepohl2, clear
                  tsset qtr
                  
                  * window bounds for a rolling window that end at the 50th observation
                  list qtr in 46
                  list qtr in 50
                  
                  * estimate model
                  regress dln_inv dln_inc dln_consump if inrange(qtr, qtr[46], qtr[50])
                  
                  * predict the 50th observation and forecast the next 3
                  predict xb
                  list qtr xb in 50/53
                  
                  * predict and forecast manually
                  dis _b[_cons] + _b[dln_inc]*dln_inc[50] + _b[dln_consump]*dln_consump[50]
                  dis _b[_cons] + _b[dln_inc]*dln_inc[51] + _b[dln_consump]*dln_consump[51]
                  dis _b[_cons] + _b[dln_inc]*dln_inc[52] + _b[dln_consump]*dln_consump[52]
                  dis _b[_cons] + _b[dln_inc]*dln_inc[53] + _b[dln_consump]*dln_consump[53]
                  You will need to repeat this process for each period in the data that terminates a rolling window. This can be done by extending the code above using a loop. You can also use Stata's rolling command. The following uses rangestat because it is vastly more efficient computationally. First, for the recursive window (note that this code should be copied to a new do-file and run as a whole; do not try to cut and paste it directly into Stata's Command window):
                  Code:
                  webuse lutkepohl2, clear
                  tsset qtr
                  
                  * --------- basic regression mata code: DO NOT CHANGE CODE BELOW ---------------
                  * linear regression in Mata using quadcross() - help mata cross(), example 2
                  mata:
                  mata clear
                  mata set matastrict on
                  real rowvector myreg(real matrix Xall)
                  {
                      real colvector y, b, Xy
                      real matrix X, XX
                  
                      y = Xall[.,1]                // dependent var is first column of Xall
                      X = Xall[.,2::cols(Xall)]    // the remaining cols are the independent variables
                      X = X,J(rows(X),1,1)         // add a constant
                      
                      XX = quadcross(X, X)        // linear regression, see help mata cross(), example 2
                      Xy = quadcross(X, y)
                      b  = invsym(XX) * Xy
                      
                      return(rows(X), b')
                  }
                  end
                  * --------- end of basic regression mata code: DO NOT CHANGE CODE ABOVE --------
                  
                  gen low = qtr[1]
                  rangestat (myreg) dln_inv dln_inc dln_consump, interval(qtr low 0) casewise
                  rename myreg* (obs b_dln_inc b_dln_consump b_cons)
                  gen xb0 = b_cons + b_dln_inc*dln_inc + b_dln_consump*dln_consump
                  gen xb1 = b_cons + b_dln_inc*F.dln_inc + b_dln_consump*F.dln_consump
                  gen xb2 = b_cons + b_dln_inc*F2.dln_inc + b_dln_consump*F2.dln_consump
                  gen xb3 = b_cons + b_dln_inc*F3.dln_inc + b_dln_consump*F3.dln_consump
                  
                  list in 50
                  You can see that the results using the window that ends at the 50th observation forecast the same values as the individual case (first code block above).

                  Now do the same using a rolling window of 5 quarters. Note that the only change is the window start period. Again, this code should be copied to a new do-file and run as a whole; do not try to cut and paste it directly into Stata's Command window.
                  Code:
                  * --------- basic regression mata code: DO NOT CHANGE CODE BELOW ---------------
                  * linear regression in Mata using quadcross() - help mata cross(), example 2
                  mata:
                  mata clear
                  mata set matastrict on
                  real rowvector myreg(real matrix Xall)
                  {
                      real colvector y, b, Xy
                      real matrix X, XX
                  
                      y = Xall[.,1]                // dependent var is first column of Xall
                      X = Xall[.,2::cols(Xall)]    // the remaining cols are the independent variables
                      X = X,J(rows(X),1,1)         // add a constant
                      
                      XX = quadcross(X, X)        // linear regression, see help mata cross(), example 2
                      Xy = quadcross(X, y)
                      b  = invsym(XX) * Xy
                      
                      return(rows(X), b')
                  }
                  end
                  * --------- end of basic regression mata code: DO NOT CHANGE CODE ABOVE --------
                  
                  rangestat (myreg) dln_inv dln_inc dln_consump, interval(qtr -4 0) casewise
                  rename myreg* (obs b_dln_inc b_dln_consump b_cons)
                  gen xb0 = b_cons + b_dln_inc*dln_inc + b_dln_consump*dln_consump
                  gen xb1 = b_cons + b_dln_inc*F.dln_inc + b_dln_consump*F.dln_consump
                  gen xb2 = b_cons + b_dln_inc*F2.dln_inc + b_dln_consump*F2.dln_consump
                  gen xb3 = b_cons + b_dln_inc*F3.dln_inc + b_dln_consump*F3.dln_consump
                  
                  list in 50
                  Again, you can check that these match the results using the individual case in the second code block above.

                  The only thing I haven't discussed is the number of observations that are used in each estimation. In the examples above, the variable obs indicates the number of observations in the regression sample for the window that ends in that quarter. You may wish to ignore the results from a certain number of cases initially and/or require a minimum sample per window. rangestat will not do this for you, you have to decide when to reject results because of insufficient sample.
                  Last edited by Robert Picard; 17 Mar 2017, 14:27.

                  Comment


                  • #10
                    Dear @RobertPicard
                    Thank for your interest
                    But in your code which executes "rolling estimation", is there any problem ?
                    Because rolling estimation should execute following algorithm

                    xb0= 1 to 50 [ 1960q1 - 1972q2 ]
                    xb1=2 to 51 [ 1960q2 - 1972q3 ]
                    xb2=3 to 52 [ 1960q3 - 1972q4 ]
                    xb3=4 to 53 [ 1960q4 - 1973q1 ]

                    Sincerely
                    Engin

                    Comment


                    • #11
                      Dear @RobertPicard

                      Comment


                      • #12
                        Hi everyone,

                        I am quite new to Stata. I would like to do out-of-sample forecasting with rolling/recursive regression, and I find the Robert Picard's code on March 16, 2017 runs very well. However, I would like to adjust it. If I understand the code correctly, the way it works is that:
                        it esimate the model based on observations 1-20, and forecast the #20 based on the estimation results.
                        it esimate the model based on observations 1-21, and forecast the #21 based on the estimation results. .......
                        I would like to do what I think to be out-of-sample forecasts as follows:
                        it esimate the model based on observations 1-20, and forecast the #21 based on the estimation results.
                        it esimate the model based on observations 1-21, and forecast the #22 based on the estimation results. .......

                        How should I modify the code to do it? Thank you!!

                        Originally posted by Robert Picard View Post
                        Here's a much more efficient way to perform a rolling regression with a recursive window using rangestat (from SSC). See my earlier post today for an example with a fixed window and with panel data. The following replicates the results from example 3 on page 7 of http://www.stata.com/manuals13/tsrolling.pdf:

                        Code:
                        clear all
                        
                        * --------- basic regression mata code: DO NOT CHANGE CODE BELOW ---------------
                        * linear regression in Mata using quadcross() - help mata cross(), example 2
                        mata:
                        mata clear
                        mata set matastrict on
                        real rowvector myreg(real matrix Xall)
                        {
                        real colvector y, b, Xy
                        real matrix X, XX
                        
                        y = Xall[.,1] // dependent var is first column of Xall
                        X = Xall[.,2::cols(Xall)] // the remaining cols are the independent variables
                        X = X,J(rows(X),1,1) // add a constant
                        
                        XX = quadcross(X, X) // linear regression, see help mata cross(), example 2
                        Xy = quadcross(X, y)
                        b = invsym(XX) * Xy
                        
                        return(rows(X), b')
                        }
                        end
                        * --------- end of basic regression mata code: DO NOT CHANGE CODE ABOVE --------
                        
                        * replicate http://www.stata.com/manuals13/tsrolling.pdf, example 3, p. 7
                        use http://www.stata-press.com/data/r13/ibm, clear
                        tsset t
                        gen double L_ibm = L.ibm
                        gen double L_spx = L.spx
                        
                        * for each observation, the sample starts with the first observation
                        * and ends at the current observation.
                        sum t
                        gen low = r(min)
                        rangestat (myreg) ibm L_ibm L_spx, interval(t low 0) casewise
                        rename myreg* (obs b_L_ibm_Return b_L_spx b_cons)
                        
                        * limit results to t >= 20
                        gen forecast0 = b_cons + b_L_ibm_Return * ibm + b_L_spx * spx if t >= 20
                        gen actual0 = F.ibm if t >= 20
                        corr actual0 forecast0
                        save "rangestat_results.dta", replace
                        
                        * repeat using the manual's code on page 7
                        program myforecast, rclass
                        syntax [if]
                        regress ibm L.ibm L.spx `if'
                        // Find last time period of estimation sample and
                        // make forecast for period just after that
                        summ t if e(sample)
                        local last = r(max)
                        local fcast = _b[_cons] + _b[L.ibm]*ibm[`last'] + ///
                        _b[L.spx]*spx[`last']
                        return scalar forecast = `fcast'
                        // Next period’s actual return
                        // Will return missing value for final period
                        return scalar actual = ibm[`last'+1]
                        end
                        
                        rolling actual=r(actual) forecast=r(forecast), recursive window(20): myforecast
                        corr actual forecast
                        
                        * combine the rolling results with the original data plus rangestat results
                        rename end t
                        merge 1:1 t using "rangestat_results.dta", assert(match using) nogen
                        sort t
                        
                        * show that the results match
                        gen dforecast = abs(forecast0 - forecast)
                        gen dactual = abs(actual0 - actual)
                        sum dforecast dactual

                        Comment

                        Working...
                        X