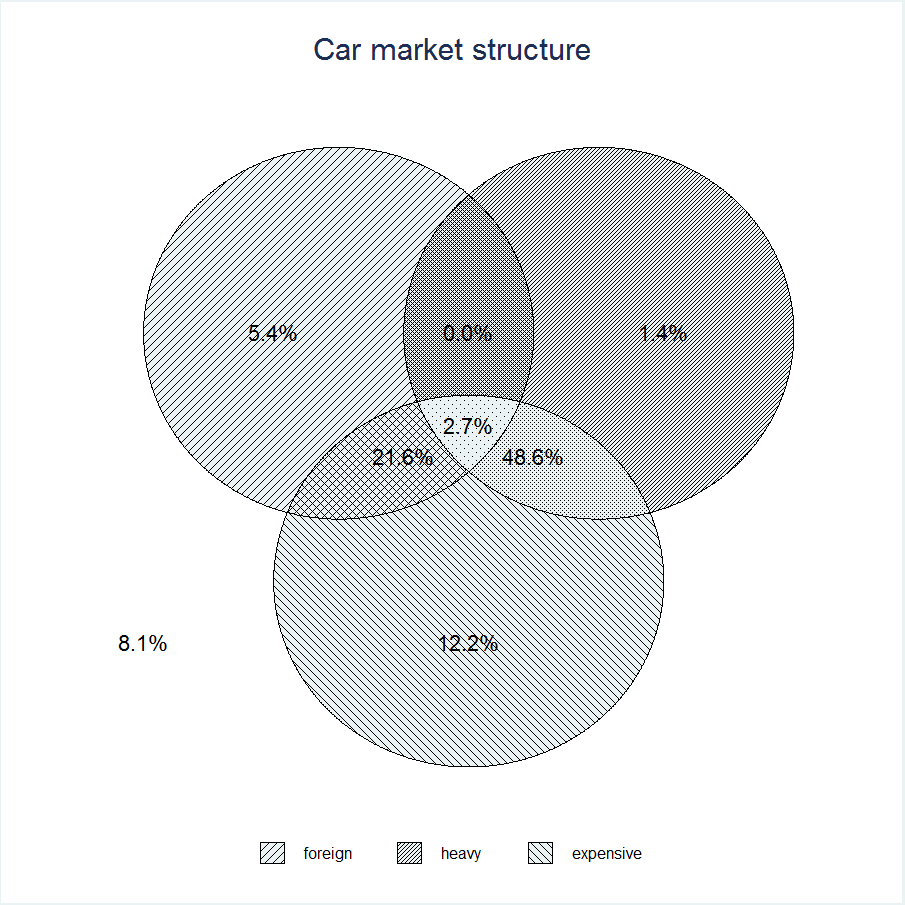
Announcement

Collapse
No announcement yet.
X
  • Filter
  • Time
  • Show
Clear All
new posts

  • old .gph files

    Dear All

    I am using the command venndiag on Stata 14. I was hoping to format the graph. I have figured out the pen coding so I can now change the colours of the circles and text. I was wondering if there was any way of changing the background of the image? Or if any other formatting is possible?

    Many thanks for any advice.

    Hema.

  • #2
    You can check VennDiagram:
    http://radyakin.org/stata/venndiagram/venndiagram.htm

    Comment


    • #3
      Dear Sergiy

      That's great. I did not realise that there was another command to use. I will have a play around with it.

      Many thanks for your prompt reply.

      Hema.

      Comment


      • #4
        Not everything is discoverable with Stata's findit command. Google for alternatives. Or search the statalist forum:
        http://www.statalist.org/forums/foru...=4553#post4553
        Best, Sergiy

        Comment


        • #5
          Many thanks!

          However, although this may help me with Venn diagrams, I'm also trying to produce frequency charts. I have not found this straight forward on Stata! I found an old Stata document by N.Cox who suggested tabulating a variable to produce a set of indicator variables, (tabulate foreign, generate(f)) and then to use that to chart, (graph f1 f2, bar). However, when I try to run this on Stata 14, it seems to not like the "bar" at the end. When I place bar after graph, I do not get what I require.

          I have found fbar, which does exactly what I am after. I have the same problem as above however. It is an old gph graph and I am struggling to change the background away from black. Can this be done on these old graphs that are not live? Or are there any other suggestions?

          Any advice on this matter is much appreciated.

          Hema.

          Comment


          • #6
            I'm also trying to produce frequency charts
            Show example of what you want to plot. How is it different from histogram?
            Sergiy

            Comment


            • #7
              I have a categorical variable: imaging per patient. It contains the three indicator variables CT, MRI and PET. I want to plot this against the year the patient was seen. Hence, I have been using: fbar year, by(imaging). This produces what I need, but I'm struggling to format it.

              Many thanks

              Hema.

              Comment


              • #8
                Originally posted by Sergiy Radyakin View Post
                Sergiy,

                If you will create a stata.toc file at http://radyakin.org/stata/ that points to each of the subdirectories there, such as venndiagram, we can add it to the nightly crawler so that -findit- will index your materials.

                Comment


                • #9
                  Post #5.

                  fbar was written in 2001 for Stata version 7!

                  The nearest current equivalents (of mine) are catplot and tabplot which you can install by

                  Code:
                  ssc inst catplot
                  Code:
                  ssc inst tabplot


                  If you need more help, tell us much more about your data and the kind of graph you want precisely.
                  Last edited by Nick Cox; 30 Apr 2015, 15:11.

                  Comment


                  • #10
                    Alan Riley (StataCorp) , thank you Alan!

                    Comment

                    Working...
                    X