Announcement

Collapse
No announcement yet.
X
  • Filter
  • Time
  • Show
Clear All
new posts

  • Test

    Some text here. Then a picture:

    Then some more text.


  • #2
    Title: Dataset of Statalist Post Titles and Dates

    Hi all,

    This is a slightly more meta post than most (and as such, may only be of interest to some), but over the course of some recent experiments with ways of scraping data from the web, I ended up creating a dataset with all Statalist post titles and associated dates from March 31st, 2014 (the start of the "new" Statalist forum) to September 8th, 2017 (the last time I ran the program). I had a lot of fun playing around with it (graphs to follow), and I thought I'd make it available more generally in case anyone else wanted to play around with it as well (of course, I know that the developers of the forum probably have access to all of these data and more, but this was just what I could easily scrape). The dataset can be accessed from github with the following command:

    Code:
    use "https://github.com/imaddowzimet/StataPrograms/raw/master/Statalist%20Dataset%20and%20Programs/StatalistPosts.dta", clear
    The general format looks like this:
    Code:
    * Example generated by -dataex-. To install: ssc install dataex
    clear
    input long Title double Date
     9526 21070
    22605 21070
    19817 20172
    10247 20045
    28512 21070
    11287 21070
     3118 21063
    12776 21070
     9188 21070
    17012 21063
    end
    format %td Date
    label values Title Title
    label def Title 3118 "clogit with survey weights from NCES data", modify
    label def Title 9188 "Frequency labels in a horizontal histogram", modify
    label def Title 9526 "Generating a new variable that captures....", modify
    label def Title 10247 "Gravity model with ppml command", modify
    label def Title 11287 "How do you create unique ids for two datasets with different data points and merge them?", modify
    label def Title 12776 "How to use a variables value as variable name in a loop?", modify
    label def Title 17012 "Months of unemployment as a new variable", modify
    label def Title 19817 "PPML, panel data", modify
    label def Title 22605 "Robust fixed effects model", modify
    label def Title 28512 "xtline graph display issues", modify
    (with top level topic titles as strings in one variable, and dates of the post in %td format in the second variable).

    Even with this small amount of information, I had a lot of fun messing around with the data. You can look at when people post questions by various intervals of time:

    By day:


    (note the dip around the holidays).

    By year (of course, 2014 and 2017 are partial years):

    Average number of posts by month, adjusting for year (I couldn't run this as a straight descriptive, since 2014 and 2017 don't have all 12 months):

    And by day of week:

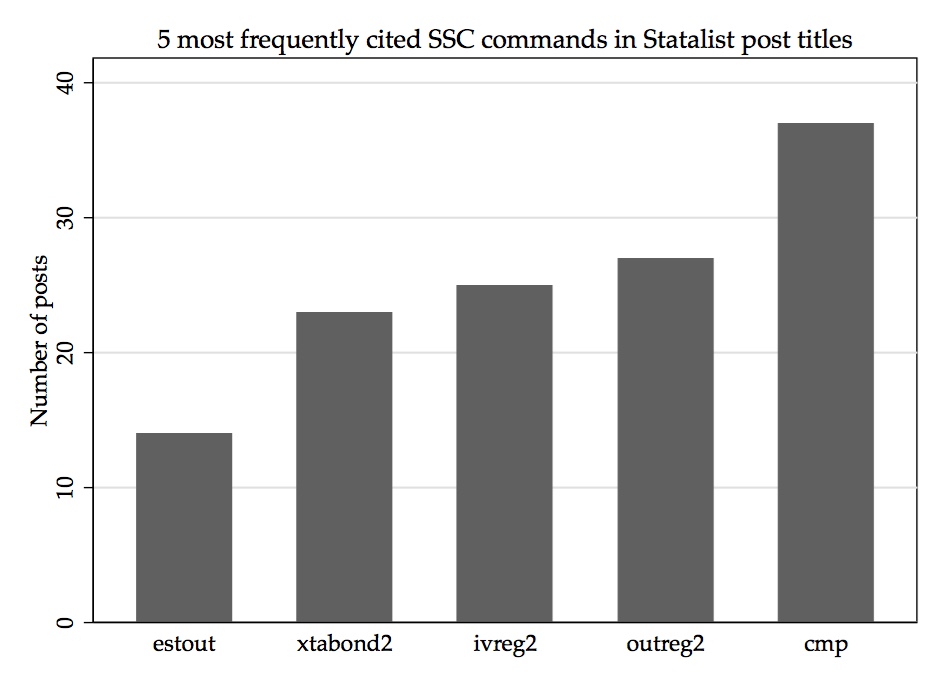
    If you want to play around with extracting information from the titles themselves, you can of course do much more. Here's one silly example -- I wanted to see which user created commands available on ssc were asked about most frequently (or at least mentioned by name in topic titles), so using the list compiled by Haghish here, I was pretty easily able to put together this graph (of course note that there's a lot of judgement calls I needed to make to limit to command names that were unambigous - that weren't common words, statistical terms, etc. - so take this with a grain of salt):


    I'm sure other people can do much more interesting things with this; these are just a few examples. Complete code to produce all these graphs is available here, and the code I used to scrape the data (in R, unfortunately, as I couldn't figure out an easy way in Stata) is here.

    Of course, this may all be so niche that no one else finds it interesting, but I thought if anyone would, it would be the Statalist community!
    Last edited by Isaac Maddow-Zimet; 17 Sep 2017, 10:25.

    Comment

    Working...
    X